


North Naples • GL Homes • Listings • Pending Sales • Closings • Home Values
-
 Riverstone
Homes For Sale Current MLS Listings -
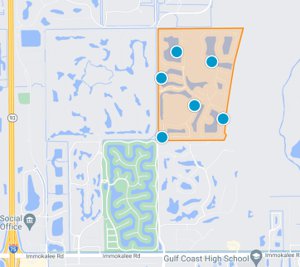 Riverstone
Map Search Lakes • Preserves • Homesites -
 Riverstone
Market Report Listings • Pending • Closings
The Riverstone Market Report is the live-data companion to the permanent Riverstone community guide. Riverstone contains approximately 802 single-family homes and a broad range of GL Homes floor plans, making the live market tables most useful after genuinely comparable residences have been separated from the overall inventory.
How to Read the Riverstone Market Report
Start With the GL Homes Model
Riverstone is particularly well suited to floor-plan-specific market analysis because buyers frequently recognize GL Homes designs by name. When the original model can be verified, same-model or closely related sales should usually be reviewed before expanding the comparable set.
Recognizable designs include Burgundy, Cabernet, Chardonnay, Carlyle, Shiraz, Dubonnet Grande and additional GL Homes plans. Each occupies a different part of the Riverstone resale market based on living area, bedroom configuration, story count and garage arrangement.
Separate Riverstone Into Meaningful Size Categories
A community-wide average can combine manageable single-story homes with five- and six-bedroom properties approaching 5,000 square feet. Those residences do not necessarily compete for the same buyer.
Lakefront Sales Require Homesite Adjustments
Riverstone contains 12 lakes, but not every water view deserves the same adjustment. Compare lake width, shoreline angle, length of view, fountain position, opposite-bank development, neighboring sight lines and rear exposure.
A long-lake perspective visible from several primary living areas can compete differently from a narrower cross-lake setting even though both properties are simply categorized as waterfront.
Preserve & Cul-de-Sac Sales
Preserve-backed homes can provide permanent natural scenery and reduced rear-neighbor visibility. Cul-de-sac homesites may provide greater side-yard area, irregular lot dimensions or additional separation from neighboring residences.
When using these properties as comparables, consider preserve depth, lot configuration, easements, setbacks, usable yard, sunlight and privacy rather than relying solely on recorded lot area.
Private Pools & Outdoor Living
Private pools are common but not universal. Compare pool size, spa, deck, screen enclosure, heater, filtration, automation, outdoor kitchen and covered-lanai depth.
The permanent setting behind the pool also matters. A pool overlooking a broad lake or deep preserve can compete differently from an otherwise similar installation on an interior homesite.
Garage Capacity
Riverstone includes both two- and three-car configurations. A third bay can influence demand for buyers needing additional vehicles, storage, bicycles, recreational equipment or workspace.
Verify actual garage dimensions, tandem arrangements, built-in storage, epoxy flooring, EV charging and any climate-control improvements instead of relying only on the advertised garage count.
Renovation, Storm Protection & Major Systems
Homes that began as the same GL Homes model may now differ significantly. Separate cosmetic renovation from capital improvements such as impact-rated openings, storm screens, generators, HVAC replacement, pool renovation and major electrical or plumbing work.
Review roof condition, HVAC equipment, water heaters, pool systems, garage-door protection, generator installation, permit history and current insurance documentation alongside kitchens, bathrooms and flooring.
Price Per Square Foot
Price per square foot can provide context after comparable homes have been separated by model and size. It should not be used as the primary valuation method across all of Riverstone.
Smaller homes can produce a higher price per square foot because land, kitchens, pools and community access are distributed across fewer interior square feet, while larger estate-scale properties can produce a lower figure despite a substantially higher total sale price.
HOA & Insurance Due Diligence
Riverstone is a gated non-golf community, so ownership is not tied to mandatory private golf membership. Buyers should nevertheless verify current HOA assessments, reserve funding, included services, landscaping responsibilities, architectural standards, leasing provisions, pet rules and planned capital projects.
Insurance should be quoted for the specific residence based on construction, roof, storm protection, pool enclosure, property size and parcel-specific flood or elevation information.
Use the Live Riverstone Tables Below
The native RealGeeks market tables below update as listings enter the market, sellers change prices, contracts are accepted and transactions close. This is preferable to hard-coding temporary inventory totals or averages into permanent page content.
After identifying a potentially comparable transaction, return to the actual property characteristics: GL Homes model, living area, story count, homesite, view, pool, rear exposure, garage, renovations, roof, mechanical systems and ownership costs.
Compare Similar Naples Gated Communities
Use these permanent community guides to compare Riverstone against other gated non-golf developments by builder, housing scale, lake or preserve setting, recreational amenities and ownership structure.





Continue Your Riverstone Research
For permanent community details, GL Homes floor-plan guidance and ownership considerations, return to the Riverstone Homes & Community Guide.
To see current competition, use the Riverstone Homes For Sale search, or compare property location using the Riverstone Map Search.
For broader alternatives, explore the Naples Gated Non-Golf Communities directory and the Naples Luxury Homes guide.
Riverstone Listings, Values & Private Tours
Schulz Realty can help buyers compare Riverstone listings with recent same-model sales and help sellers evaluate their GL Homes floor plan, lake or preserve homesite, pool, exposure, garage, upgrades, ownership obligations and current competition.
Contact Schulz Realty for Listings & Private ToursRiverstone inventory, asking prices, pending transactions, closed sales, days on market, price per square foot, GL Homes model attribution, HOA assessments, reserves, insurance requirements, flood information and individual property features can change. Verify material real-estate, association, insurance, inspection, survey, permit, tax, title and public-record information using current sources appropriate to the specific property.
 The data relating to real estate for sale on this web site comes in part from the Broker Reciprocity Program (BR Program) of M.L.S. of Naples, Inc. Properties listed with brokerage firms other than this company are marked with the BR Program Icon or the BR House Icon and detailed information about them includes the name of the listing brokers. The properties displayed may not be all the properties available through the BR Program. The information provided is for consumers’ personal, non-commercial use and may not be used for any other purpose.