(239) 682-5800 Naples Luxury Homes & Condos | Schulz Realty Buyers Agents

Olde Naples Condos Market Report

or Create your own market report

The Olde Naples Condos Market Report provides current inventory and recent transaction information. Begin comparisons with the exact building or condominium community, then consider residence size, location, views, outdoor space, parking and association condition.

Use the Olde Naples Condos guide to identify communities before interpreting the report averages. A garden condominium, a large Fifth Avenue residence and a waterfront property may serve different buyer markets.

How to Read the Report

  • Active listings: Asking prices show available competition and seller expectations, rather than completed transaction values.
  • Pending sales: Where available, pending listings indicate properties under contract. Final prices and terms remain subject to closing.
  • Closed sales: Compare sale date, building, residence size, position and condition before selecting a transaction as a comparable.
  • Price per square foot: Compare consistent interior living areas. Views, terraces, garages, boating rights and association obligations can affect value separately.
  • Days on market: Review pricing history, construction status and residence characteristics alongside the displayed marketing period.

Building-Level Differences Matter

Use recent same-building sales when suitable examples exist. If the sample is limited, expand to communities with similar construction, location, residence scale, outdoor living and parking. Do not assume that nearby buildings carry the same ownership costs or amenities.

For waterfront residences, distinguish water views from legal dock or boat-slip rights. For newer developments, separate advertised pre-construction prices from completed transactions. Review association reserves, insurance, assessments and anticipated capital work alongside the interior condition of the residence.

Related Olde Naples Guides
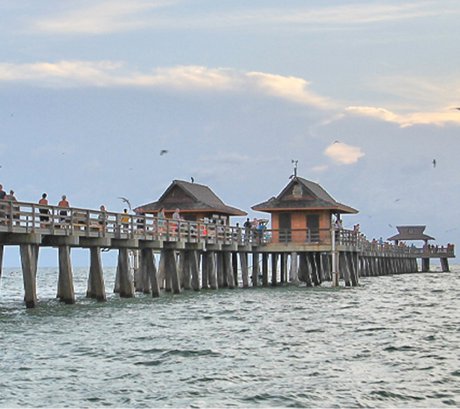
For a wider location comparison, explore Downtown Naples Condos . Keep condominium comparisons separate from detached-home transactions when reviewing the broader Olde Naples market.

Request an Olde Naples Condo Market Review

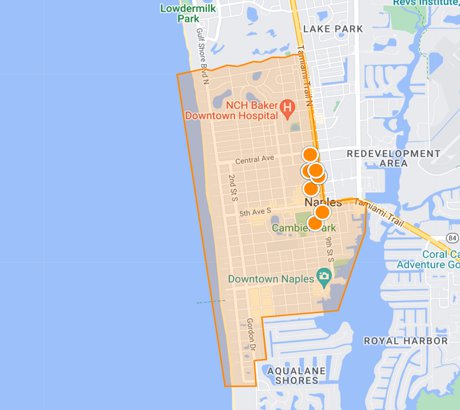
Contact Schulz Realty LLC for a property-specific comparison of current competition and recent sales. Explore the current Olde Naples condo listings and Olde Naples condo map alongside the report data.

Listings, prices and market statistics change. Information is deemed reliable but not guaranteed. Verify measurements, property classifications, ownership rights, association information and transaction details through current records and appropriate professionals. Report averages do not establish an individual residence's value.

Back to Top

Olde Naples Condo Listings and Recent Sales

Review the available report tables below. Compare similar buildings and residence types before interpreting averages.

Active Properties
Address Beds Baths Living ft2 List Price Cost per ft2 DOM
1165 8TH ST S Unit #302 4 4.5 4,378 $7,695,000 $1,757 86 days
1165 8TH ST S Unit #202 4 4.5 4,378 $6,795,000 $1,552 86 days
745 12th AVE S Unit 103 3 4.5 4,856 $6,450,000 $1,328 338 days
1165 8TH ST S Unit #201 4 4.5 4,371 $5,995,000 $1,371 86 days
495 5th ST S Unit 304 2 2.5 2,446 $3,595,000 $1,469 217 days
430 10th AVE S Unit 305 3 3 2,280 $3,190,000 $1,399 58 days
382 12th AVE S Unit 202 3 3.5 2,429 $2,850,000 $1,173 73 days
411 6th ST S Unit 301 3 2 1,734 $2,799,000 $1,614 63 days
875 6th AVE S Unit 304 3 3.5 2,365 $2,775,000 $1,173 113 days
165 5TH ST S Unit 3 3 3 1,951 $2,700,000 $1,383 28 days
705 10th ST S Unit 202 3 3.5 2,930 $2,700,000 $921 85 days
780 5th AVE S Unit 305 2 2.5 1,932 $2,700,000 $1,397 353 days
780 5th AVE S Unit 203 2 2.5 1,800 $2,695,000 $1,497 70 days
572 11th AVE S Unit 2 3 4 2,522 $2,600,000 $1,030 2 days
82 9th ST S Unit 205 2 2 2,131 $2,595,000 $1,217 34 days
292 14th AVE S Unit A 3 3 2,038 $2,499,000 $1,226 232 days
360 7th AVE S Unit 4 3 2 1,664 $2,300,000 $1,382 6 days
225 5th AVE S Unit 103 3 3 1,728 $2,250,000 $1,302 147 days
1001 10th AVE S Unit 211 3 3 3,379 $2,250,000 $665 608 days
365 5th AVE S Unit 305 2 2 1,225 $2,100,000 $1,714 6 days
1001 10th AVE S Unit 206 3 3 3,387 $2,050,000 $605 58 days
201 8th ST S Unit 208 2 2.5 1,704 $1,999,999 $1,173 115 days
201 8th St S #309 2 2.5 1,559 $1,999,000 $1,282 50 days
850 Central AVE Unit 207 3 3 1,638 $1,995,000 $1,217 50 days
611 10th AVE S Unit B2 3 2 1,857 $1,900,000 $1,023 26 days
365 5th AVE S Unit 307 2 2 1,150 $1,870,000 $1,626 99 days
545 11th AVE S Unit 104 3 2 1,447 $1,699,000 $1,174 398 days
850 Central AVE Unit 204 2 2 1,397 $1,595,000 $1,141 217 days
850 Central Unit 303 2 2 1,397 $1,590,000 $1,138 348 days
850 Central AVE Unit 209 2 2 1,401 $1,495,000 $1,067 248 days
850 Central AVE Unit 311 2 2 1,209 $1,475,000 $1,220 167 days
995 9th AVE S Unit 5 3 2.5 2,024 $1,350,000 $666 14 days
995 9th AVE S Unit 4 2 2.5 1,861 $1,274,900 $685 7 days
280 2nd AVE S Unit 303 2 2 1,162 $1,245,000 $1,071 42 days
990 8TH ST S Unit 1C 2 2 1,492 $1,225,000 $821 28 days
666 3rd ST S Unit 202 2 2 1,384 $1,150,000 $830 22 days
101 8th ST S Unit 201 2 2 902 $1,149,000 $1,273 278 days
175 5th AVE S Unit 4 2 2 735 $1,089,000 $1,481 71 days
415 10th AVE S Unit 7 2 2 1,372 $1,075,000 $783 58 days
666 3rd ST S Unit 101 2 2 1,285 $950,000 $739 9 days
1222 Gordon DR Unit 2 2 2 1,125 $899,000 $799 253 days
1100 9th ST S Unit C-103 2 2 1,440 $799,900 $555 2 days
1065 8th ST S Unit 203 2 2 1,217 $799,900 $657 251 days
211 3rd AVE S Unit 211 2 2 1,250 $799,000 $639 189 days
900 Broad AVE S Unit 133/134 2 2 800 $775,000 $968 22 days
1295 Gulf Shore BLVD S Unit 134 2 2 662 $725,000 $1,095 248 days
900 8th AVE S Unit 103 2 2 1,092 $655,000 $599 56 days
721 9th ST S Unit 1 2 2 1,132 $650,000 $574 387 days
480 5th ST S Unit 202 1 1 536 $625,000 $1,166 166 days
1100 8th AVE S Unit 210B 2 2 1,080 $620,000 $574 44 days
Average: 2.1 2.1 1,461 $1,563,450 $969 134 days
Viewing 1 - 50 of 75
Sold Properties
Address Beds Baths Living ft2 List Price Sold Price Cost per ft2 DOM Sold Date
477 3rd AVE S Unit 2 3 3.5 2,563 $4,200,000 $3,975,000 $1,550 106 days 7/10/26
201 8TH ST S Unit 103 4 5.5 3,449 $3,995,000 $3,800,000 $1,101 381 days 5/15/26
82 9th ST S Unit 303 3 3.5 2,875 $3,950,000 $3,450,000 $1,200 529 days 9/9/26
985 8th AVE S Unit 102 3 3.5 3,128 $3,495,000 $3,200,000 $1,023 28 days 6/15/26
909 10th ST S Unit 201 4 4.5 3,282 $2,950,000 $2,800,000 $853 38 days 6/15/26
1005 4th ST S Unit 203 3 3 2,717 $2,995,000 $2,775,000 $1,021 67 days 6/2/26
230 6th AVE S Unit 12 3 3.5 1,950 $2,750,000 $2,650,000 $1,358 66 days 4/30/26
1104 6th ST S Unit 1 3 3 2,590 $2,850,000 $2,475,000 $955 152 days 7/29/26
552 11th AVE S Unit 4 3 3 2,330 $2,725,000 $2,425,000 $1,040 66 days 6/29/26
888 10th ST S Unit 101 3 3.5 3,163 $2,350,000 $2,350,000 $742 78 days 6/11/26
375 5th AVE S Unit 302 2 2 1,410 $2,250,000 $2,250,000 $1,595 60 days 8/12/26
750 11th ST S Unit C 3 3.5 2,955 $2,395,000 $2,250,000 $761 223 days 6/15/26
201 8th ST S Unit #104 3 3.5 2,064 $2,399,500 $2,245,000 $1,087 179 days 9/29/26
780 5th AVE S Unit 303 2 2.5 1,781 $2,495,000 $2,200,000 $1,235 49 days 6/5/26
692 10th AVE S 3 3 2,321 $2,295,000 $2,120,000 $913 64 days 8/3/26
625 5TH AVE S Unit 302 3 2.5 2,495 $2,295,000 $2,075,000 $831 70 days 10/1/26
600 5th AVE S Unit A-211 2 2 2,820 $1,995,000 $1,875,000 $664 62 days 8/12/26
863 9th AVE S Unit 202 3 3.5 2,670 $2,295,000 $1,800,000 $674 125 days 7/7/26
201 8th ST S Unit 308 2 2.5 1,704 $1,975,000 $1,800,000 $1,056 126 days 5/8/26
780 5th AVE S Unit 306 2 2.5 1,781 $1,895,000 $1,730,000 $971 150 days 5/1/26
625 6th AVE S Unit B301 2 2 1,788 $1,559,000 $1,500,000 $838 73 days 10/19/26
850 Central AVE Unit 301 2 2 1,482 $1,700,000 $1,500,000 $1,012 52 days 5/14/26
1325 7th ST S Unit 7A 2 2 1,536 $1,525,000 $1,450,000 $944 61 days 5/27/26
600 3rd ST S Unit 2 3 2 1,600 $1,550,000 $1,450,000 $906 127 days 7/8/26
1100 3rd ST S Unit 202 2 2 1,663 $1,495,000 $1,350,000 $811 147 days 5/7/26
231 3rd AVE S Unit 231 2 2 1,275 $1,295,000 $1,227,500 $962 162 days 10/9/26
638 7th AVE S Unit B638 4 4 1,860 $1,295,000 $1,125,000 $604 97 days 7/23/26
604 7th AVE S Unit A-604 3 4 2,274 $1,149,000 $1,050,000 $461 293 days 7/1/26
850 6th AVE N Unit 204 3 2 1,846 $1,100,000 $1,020,000 $552 141 days 8/27/26
1100 9th ST S Unit A201 3 2.5 2,017 $649,000 $649,000 $321 1 day 8/10/26
280 2nd AVE S Unit 103 2 2 1,162 $700,000 $625,000 $537 115 days 6/8/26
1100 8th AVE S Unit A205 2 2 1,080 $575,000 $525,000 $486 667 days 5/7/26
1100 8th AVE S Unit 106C 2 2 1,100 $559,000 $510,000 $463 54 days 7/10/26
277 8th AVE S Unit 277 1 1 532 $499,000 $485,000 $911 86 days 6/19/26
900 8th AVE S Unit 104 2 2 1,142 $479,000 $465,000 $407 221 days 5/20/26
721 9th ST S Unit 4 1 1 570 $449,000 $430,000 $754 374 days 8/4/26
1100 8th AVE S Unit 105A 2 2 925 $470,000 $400,000 $432 47 days 4/30/26
900 Broad AVE S Unit 110 1 1 450 $428,000 $390,000 $866 134 days 5/27/26
223 8th AVE S Unit 223B 1 1 564 $269,900 $269,900 $478 5 days 9/24/26
Average: 2.5 2.6 1,920 $1,853,728 $1,709,394 $856 143 days
Viewing 1 - 39 of 39

How much is your Naples FL home worth?

...get instant property value now!

The data relating to real estate for sale on this web site comes in part from the Broker Reciprocity Program (BR Program) of M.L.S. of Naples, Inc. Properties listed with brokerage firms other than this company are marked with the BR Program Icon or the BR House Icon and detailed information about them includes the name of the listing brokers. The properties displayed may not be all the properties available through the BR Program. The information provided is for consumers’ personal, non-commercial use and may not be used for any other purpose.