(239) 682-5800 Naples Luxury Homes & Condos | Schulz Realty Buyers Agents

Marco Beach Marco Island Homes Market Report

or Create your own market report

Marco Beach Homes Market Report

Marco Island Single-Family Homes • Waterfront & Inland Sales • Market Value Guide
The Marco Beach market includes a broad range of single-family residences across Marco Island, from inland pool homes and established canal properties to newer waterfront residences and exceptional direct-access estates.

Because these properties can differ dramatically in homesite, water access, age, condition and construction quality, a useful market report should not reduce Marco Beach to one average sale price or one price-per-square-foot number.

Best way to read the Marco Beach market: separate direct-access waterfront, bridge-restricted waterfront and inland homes first; then compare view, boating route, lot, construction, condition, pool, seawall, dock, storm protection and recent comparable sales within the correct segment.

Marco Beach Is Several Markets Within One MLS Subdivision

Two properties can both carry the Marco Beach subdivision name while competing in completely different price categories. The permanent homesite usually establishes the first level of comparison.

Direct Gulf Access No-fixed-bridge routes, wider waterways, faster access and substantial dockage can command major premiums.
Bridge-Restricted Waterfront Still valuable for boating, but vessel clearance and route limitations should be incorporated into value.
Wide-Water & Premium Views Long canal, bay, river or converging-water views often compete above ordinary canal frontage.
Inland Pool Homes Value is influenced more heavily by location, renovation, construction, pool and beach convenience.

Waterfront Value Starts With the Boating Route

A waterfront label alone is not enough. Buyers should confirm whether the route to open water contains fixed bridges and evaluate actual bridge clearance, canal width, water depth, turning space and travel time for the intended vessel.

Dock configuration should also be reviewed independently. Boat-lift capacity, dock dimensions, pilings, electrical service, water service, seawall condition and permit history can materially affect both utility and future expense.

Boating due diligence: match the property's actual route and dockage to the vessel's length, beam, draft and air draft. Do not assume that every Gulf-access Marco Beach home accommodates the same boat.

Seawall & Waterfront Infrastructure

Seawall condition can be one of the largest non-cosmetic considerations in a Marco Beach waterfront purchase. Review age, materials, prior repairs, cap condition, drainage, tiebacks where applicable and available permit history.

A renovated interior does not offset significant waterfront infrastructure needs. Likewise, a strong seawall, functional dock and appropriately sized lift can improve the practical value of an older home.

View, Exposure & Lot Position

Water frontage should be evaluated for more than linear feet. Long-water views, intersecting canals, bay exposure, river frontage and Gulf-facing positions can create substantially different buyer demand.

Rear exposure affects sunlight over the pool and lanai. Some buyers prioritize western sunset exposure, while others prefer shade during warmer afternoon hours. Exposure should therefore be considered together with the view and outdoor-living configuration.

Newer Construction vs. Established Homes

Marco Beach includes older island residences, extensively renovated homes and newer custom construction. Comparing them solely by square footage can be misleading.

Newer homes may offer elevated construction, impact-rated openings, contemporary floor plans, generators, modern mechanical systems, larger garages and more elaborate outdoor environments. Established homes may compete strongly when they occupy a superior homesite or have undergone comprehensive renovations.

Roof, Storm Protection & Insurance

Buyers should verify roof installation history, available permits, impact windows and doors, shutters, garage-door protection, elevation information and available wind-mitigation documentation.

Flood and property insurance should be evaluated for the specific home. Waterfront location, elevation, roof condition, construction type, openings and prior improvements can materially affect underwriting.

How to Compare Recent Marco Beach Sales

Start with properties that share the same fundamental market position. A direct-access waterfront residence should generally be compared with other direct-access homes before using an inland or bridge-restricted sale.

After aligning the homesite, adjust for water view, boating route, frontage, lot dimensions, house size, age, pool, seawall, dockage, renovation quality, roof, storm protection and major systems.

This segmented approach is usually more reliable than applying one Marco Beach median or one broad Marco Island price-per-square-foot figure to every property.

What Sellers Should Watch

Marco Beach sellers should identify the specific group of homes a buyer is likely to compare. Price against the property's real competitive set, not simply all active Marco Island homes.

Waterfront sellers should document seawall, dock, lift and boating features. All sellers benefit from organized roof, permit, storm protection, mechanical-system and renovation records because these details can reduce uncertainty during negotiations.

What Buyers Should Watch

Buyers should decide early whether the priority is boating, view, proximity to the beach, newer construction, pool living, renovation quality or a combination of these factors.

That decision narrows the comparable market and prevents a visually attractive property from being compared with homes that serve a completely different lifestyle.

Explore Related Marco Island Home Markets
Marco Beach Market Analysis & Private Tours

Request current Marco Beach inventory, recent comparable sales, waterfront analysis or a private showing.

Contact Schulz Realty for Listings & Private Tours

Current Marco Beach Homes for Sale

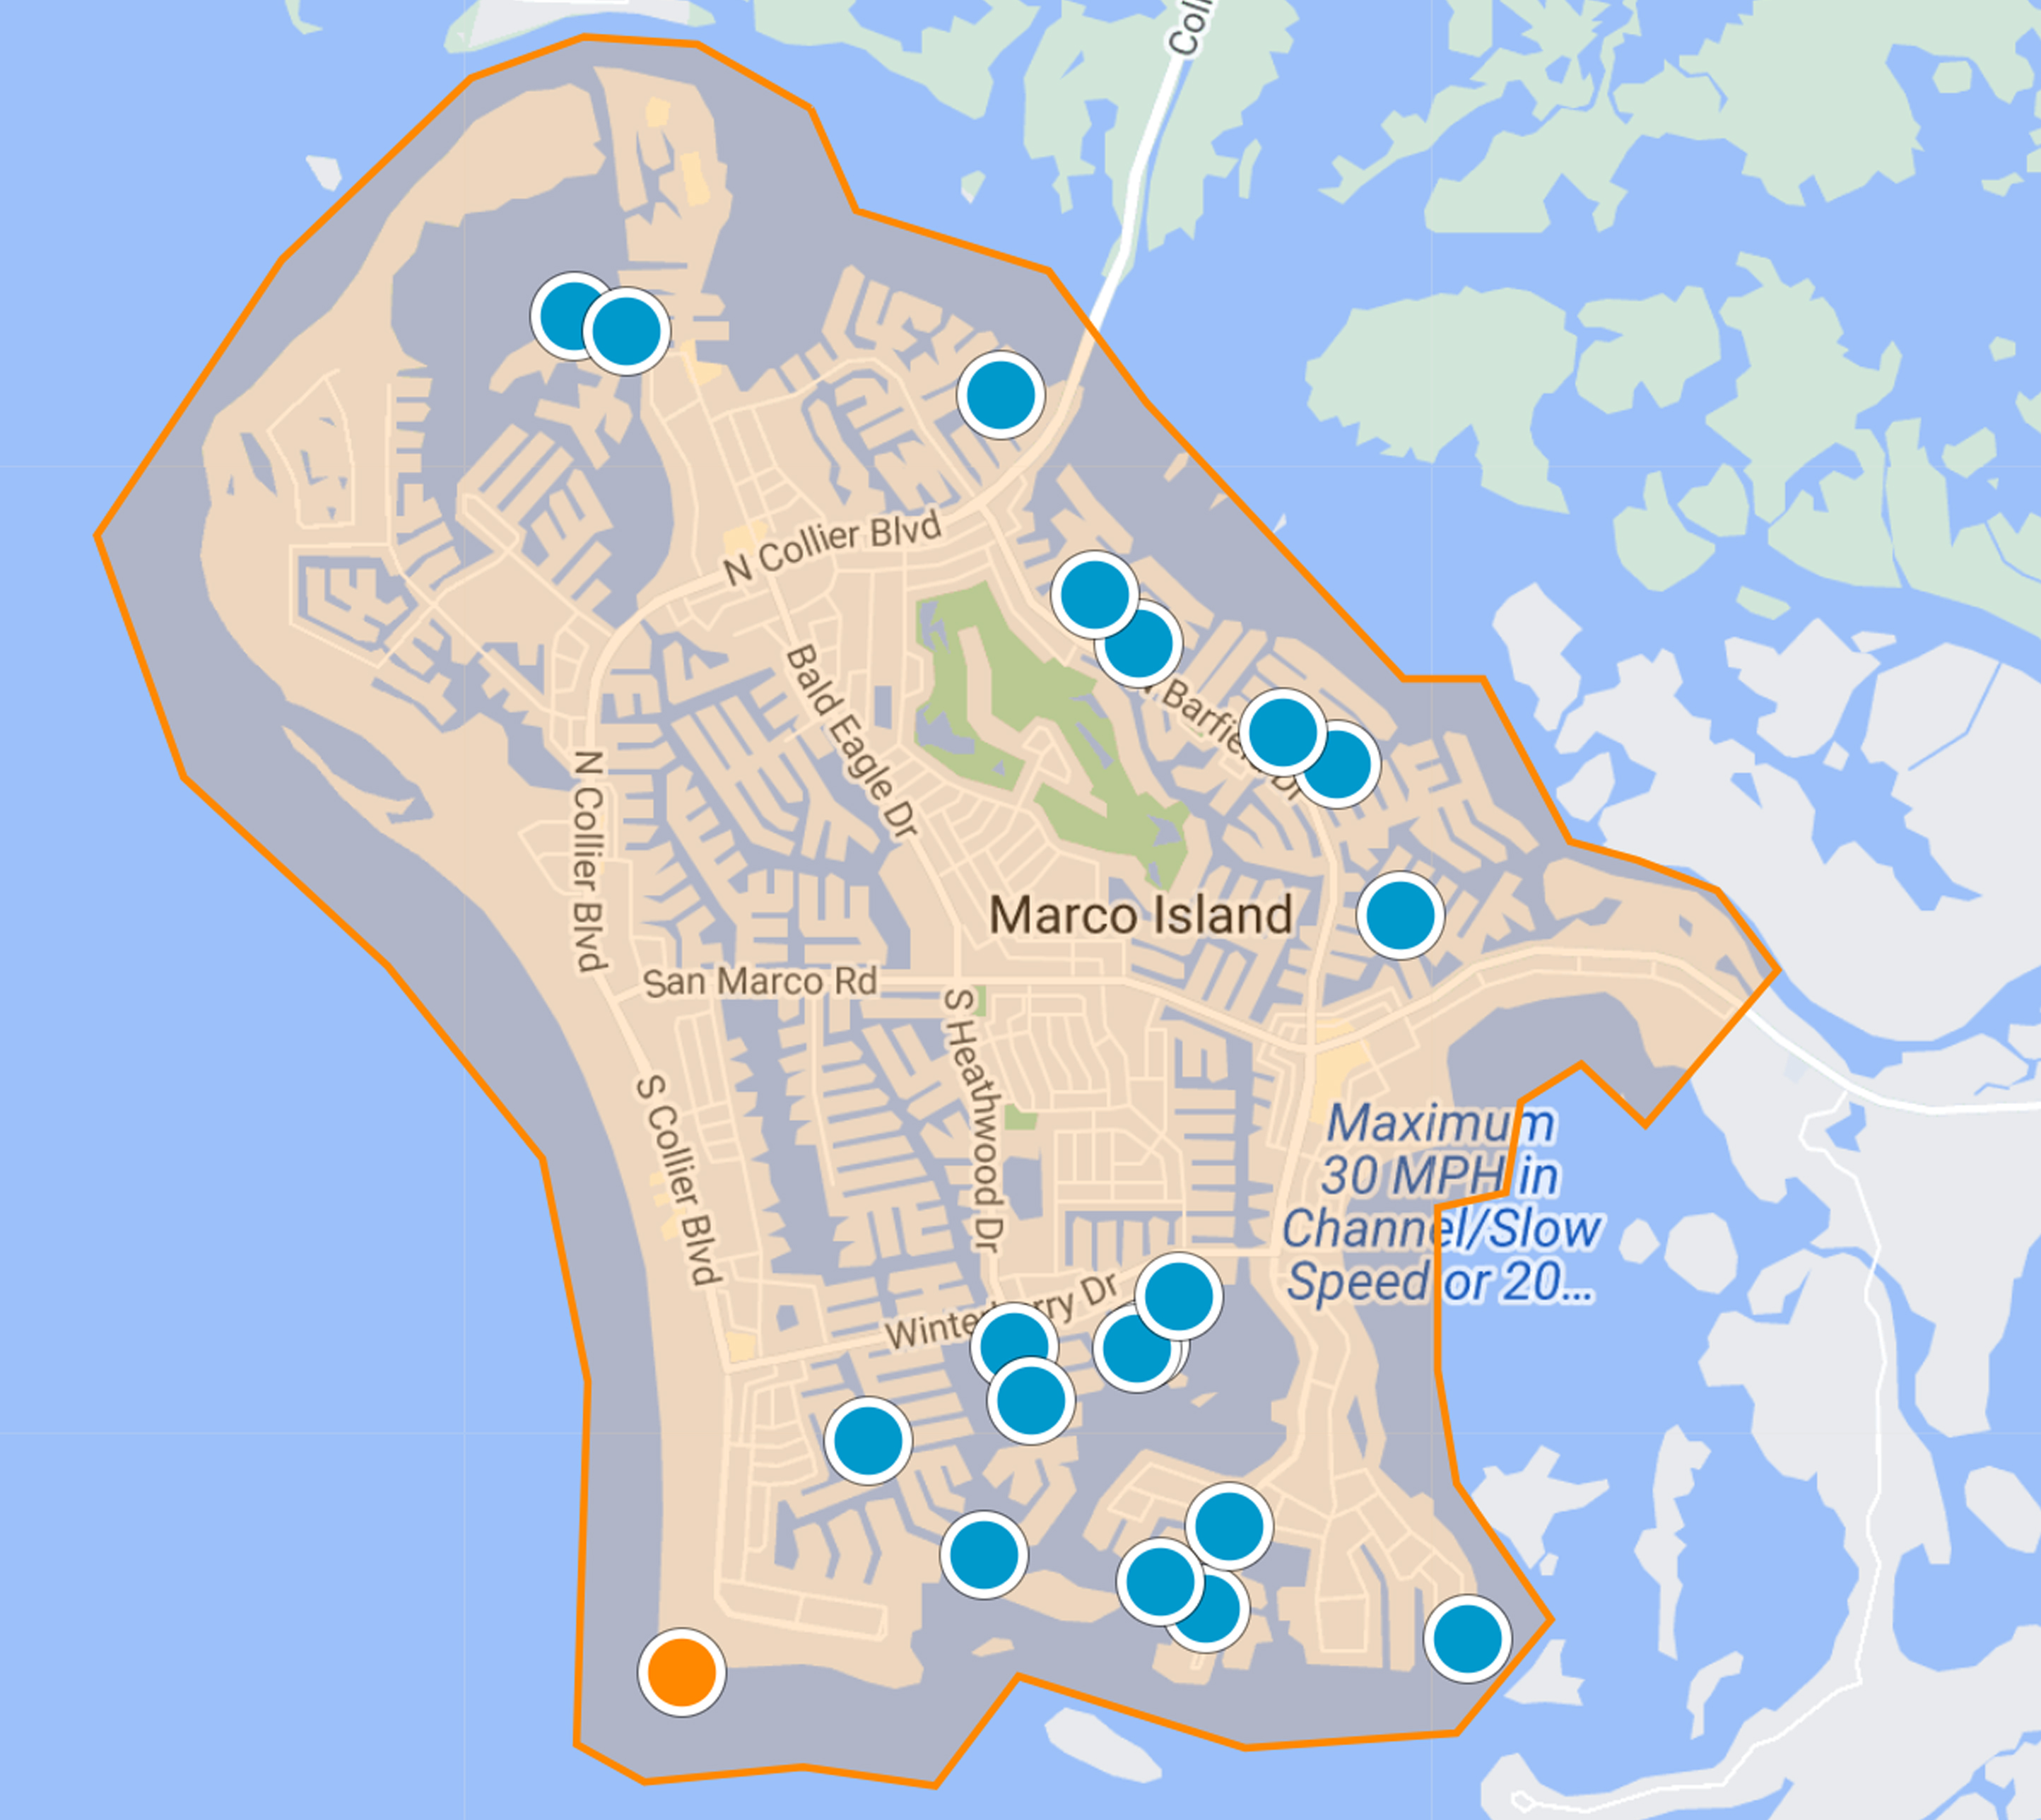
Review the live MLS inventory below for current Marco Beach single-family homes. Active inventory changes continuously, so current listings should be interpreted together with recent closed sales and the property's specific waterfront or inland market segment.

Property availability, MLS status, prices, boating routes, bridge clearances, water depth, seawall condition, dock dimensions, lift capacity, waterfront classification, flood information, elevation, insurance availability, rental rules, permit history and individual property features may change. Buyers and sellers should verify all material information through current MLS records, surveys, inspections, insurance professionals, municipal records, marine professionals and other appropriate qualified sources.

Back to Top ↑

Active Properties
Address Beds Baths Living ft2 List Price Cost per ft2 DOM
1451 Caxambas CT 4 4 4,994 $12,275,000 $2,457 120 days
1798 Wavecrest CT 6 9.5 6,255 $12,000,000 $1,918 170 days
1355 Caxambas CT N/A N/A N/A $8,150,000 Unknown 1320 days
620 Rockport CT N/A N/A N/A $6,500,000 Unknown 58 days
1791 Addison CT 5 6.5 5,473 $6,050,000 $1,105 165 days
641 Dorando CT 4 5.5 4,035 $5,990,000 $1,484 369 days
573 Goldcoast CT 4 5.5 4,035 $5,890,000 $1,459 102 days
159 Dan River CT 5 5.5 4,345 $5,449,000 $1,254 340 days
701 Plantation CT 4 4.5 4,740 $5,195,000 $1,095 126 days
931 Ivory CT 4 3.5 2,467 $4,950,000 $2,006 94 days
450 Pepperwood CT 5 6.5 4,291 $4,850,000 $1,130 182 days
1850 Apataki CT 5 5.5 4,888 $4,650,000 $951 346 days
131 Templewood CT 3 3 3,017 $4,499,900 $1,491 99 days
870 Partridge CT 3 2.5 2,866 $4,050,000 $1,413 30 days
1065 Cottonwood CT 3 4.5 3,193 $3,969,000 $1,243 134 days
218 Dan River CT 3 3.5 2,949 $3,960,000 $1,342 225 days
1813 Menorca CT 4 3.5 2,853 $3,750,000 $1,314 184 days
630 Bimini AVE 4 3.5 2,651 $3,749,000 $1,414 340 days
1702 Ludlow RD 4 3 2,836 $3,550,000 $1,251 89 days
1578 S Barfield CT 4 4.5 4,139 $3,500,000 $845 89 days
1135 Bluebird AVE 5 5.5 4,803 $2,999,995 $624 31 days
996 Spruce CT N/A N/A N/A $2,985,000 Unknown 193 days
153 Stillwater CT N/A N/A N/A $2,950,000 Unknown 151 days
255 Columbus WAY 5 4.5 3,607 $2,950,000 $817 183 days
1115 Caxambas DR N/A N/A N/A $2,495,000 Unknown 572 days
1045 Cottonwood CT 3 2.5 2,401 $2,275,000 $947 22 days
641 Hernando DR 3 3.5 1,900 $2,199,999 $1,157 20 days
1978 San Marco RD 3 2.5 2,198 $2,175,000 $989 576 days
1159 Whiteheart CT 3 2.5 2,200 $2,150,000 $977 316 days
1775 Waterfall CT 3 2 2,007 $2,125,000 $1,058 164 days
10 Anchor CT 4 3.5 2,844 $1,999,000 $702 36 days
150 Greenview ST 4 3 2,312 $1,950,000 $843 11 days
1601 Rainbow CT 4 3.5 3,063 $1,899,000 $619 464 days
225 Geranium CT N/A N/A N/A $1,800,000 Unknown 514 days
154 Hollyhock CT 2 2.5 1,732 $1,799,000 $1,038 18 days
1787 Dogwood DR 4 3.5 2,688 $1,799,000 $669 53 days
6 Tahiti RD 4 3.5 2,411 $1,785,000 $740 31 days
212 Angler CT 2 1.5 1,181 $1,650,000 $1,397 16 days
609 Spinnaker DR N/A N/A N/A $1,595,000 Unknown 1027 days
1748 Wavecrest CT N/A N/A N/A $1,500,000 Unknown 684 days
375 Wales CT N/A N/A N/A $1,499,000 Unknown 86 days
1610 Collingswood CT 3 2 2,309 $1,380,000 $597 8 days
765 N BARFIELD DR 2 2 1,892 $1,349,000 $713 35 days
756 Apple CT 3 2 1,116 $1,300,000 $1,164 170 days
1800 Woodbine CT 3 2 1,923 $1,029,000 $535 374 days
139 Balfour DR 3 2 1,476 $989,000 $670 121 days
1321 N Collier BLVD 3 2 2,183 $889,000 $407 222 days
571 S Barfield DR N/A N/A N/A $845,000 Unknown 15 days
78 Sand Hill ST 3 2 1,538 $799,000 $519 59 days
889 Scott DR N/A N/A N/A $729,000 Unknown 234 days
Average: 3.7 3.7 3,020 $3,177,488 $1,086 230 days
Viewing 1 - 50 of 53
Sold Properties
Address Beds Baths Living ft2 List Price Sold Price Cost per ft2 DOM Sold Date
1485 Caxambas CT N/A N/A N/A $6,500,000 $6,000,000 Unknown 145 days 6/30/26
517 N Barfield DR 4 4.5 5,474 $5,499,000 $5,150,000 $940 267 days 3/18/26
109 S Seas CT 4 4.5 3,601 $4,800,000 $4,595,000 $1,276 298 days 3/31/26
1411 Quintara CT 4 4.5 5,896 $4,685,000 $4,400,000 $746 215 days 5/21/26
486 Clifton CT 4 4 4,200 $4,000,000 $3,900,000 $928 52 days 8/20/26
1251 Marlin CT 5 4.5 3,455 $3,800,000 $3,700,000 $1,070 46 days 6/26/26
474 Pepperwood CT 3 3.5 3,372 $3,890,000 $3,600,000 $1,067 94 days 6/22/26
1075 Bonita CT 5 4.5 3,264 $3,875,000 $3,500,000 $1,072 24 days 6/4/26
650 Rockport CT 4 3.5 3,661 $3,649,000 $3,250,000 $887 245 days 6/3/26
1722 N BAHAMA AVE 3 3.5 3,169 $3,200,000 $3,175,000 $1,001 58 days 9/10/26
820 Giralda CT 3 3 2,327 $3,250,000 $3,100,000 $1,332 137 days 5/1/26
1649 McIlvaine CT 4 3 3,161 $3,500,000 $3,000,000 $949 137 days 4/20/26
782 Saturn CT 4 3.5 3,264 $3,000,000 $2,850,000 $873 30 days 4/16/26
829 Bluebonnet CT 4 3 2,780 $3,249,000 $2,850,000 $1,025 101 days 5/15/26
1148 Lamplighter CT 4 3.5 2,854 $2,650,000 $2,575,000 $902 16 days 7/28/26
980 N Barfield DR 4 3 2,532 $2,599,000 $2,375,000 $937 167 days 6/5/26
140 Starfish CT 4 3.5 2,564 $2,450,000 $2,345,000 $914 69 days 5/29/26
520 Alameda CT 4 3.5 3,195 $2,700,000 $2,320,000 $726 189 days 5/12/26
1156 Bond CT 3 2 1,961 $2,325,000 $2,300,000 $1,172 40 days 4/8/26
316 Waterleaf CT 4 3 2,584 $2,250,000 $2,075,000 $803 126 days 7/13/26
610 Partridge CT 3 3.5 3,588 $2,399,000 $2,000,000 $557 83 days 3/30/26
895 Banyan CT N/A N/A N/A $2,300,000 $2,000,000 Unknown 483 days 8/27/26
864 Magnolia CT 3 2 2,203 $1,950,000 $1,900,000 $862 151 days 4/24/26
1111 Abbeville CT 4 2 1,901 $1,997,000 $1,850,000 $973 211 days 5/28/26
1369 N Collier BLVD 3 4.5 2,124 $1,999,000 $1,800,000 $847 135 days 6/15/26
931 Snowberry CT 3 2 1,999 $1,899,000 $1,775,000 $887 98 days 6/5/26
179 Dan River CT 3 2 2,505 $1,899,000 $1,750,000 $698 60 days 6/15/26
1362 San Marco RD 5 4 2,396 $1,799,000 $1,715,000 $715 596 days 6/17/26
1782 Hummingbird CT 3 2.5 1,897 $1,690,000 $1,665,000 $877 54 days 4/8/26
450 N Barfield DR N/A N/A N/A $1,775,000 $1,637,500 Unknown 251 days 7/9/26
742 Orchid CT 3 2.5 3,102 $1,995,000 $1,632,000 $526 203 days 5/5/26
248 Polynesia CT 3 3 2,469 $1,700,000 $1,620,000 $656 42 days 4/24/26
72 N Barfield DR 3 2 1,727 $1,699,500 $1,600,000 $926 13 days 6/30/26
778 Bluebonnet CT 3 2 2,250 $1,650,000 $1,600,000 $711 86 days 4/15/26
1346 San Marco RD 4 3 2,160 $1,645,000 $1,585,000 $733 280 days 6/30/26
434 Tarpon CT N/A N/A N/A $1,625,000 $1,575,000 Unknown 67 days 3/24/26
679 Seagrape DR 3 3 2,374 $1,599,000 $1,525,000 $642 119 days 7/7/26
445 S Heathwood DR 4 4.5 2,646 $1,649,900 $1,500,000 $566 197 days 7/30/26
100 Lamplighter DR 3 2 2,048 $1,499,000 $1,480,000 $722 32 days 6/15/26
138 Kirkwood ST 4 3 2,278 $1,490,000 $1,400,000 $614 218 days 7/17/26
1211 Butterfly CT N/A N/A N/A $1,450,000 $1,325,000 Unknown 1 day 8/31/26
121 Channel CT 3 3.5 2,412 $1,295,000 $1,295,000 $536 77 days 3/16/26
68 Tahiti RD 3 2 1,684 $1,299,000 $1,275,000 $757 68 days 8/18/26
1035 Admiralty CT 3 2 1,488 $1,345,000 $1,260,000 $846 122 days 6/24/26
751 Orchid CT 2 2.5 1,711 $1,380,000 $1,250,000 $730 32 days 8/6/26
1616 Ludlow RD 4 3 3,117 $1,199,000 $1,250,000 $401 49 days 6/11/26
268 Bass CT 3 2 1,900 $1,300,000 $1,250,000 $657 133 days 4/27/26
334 Grapewood CT 4 3 2,578 $1,295,000 $1,200,000 $465 473 days 5/13/26
306 Colonial AVE 4 3 1,836 $1,189,500 $1,150,000 $626 46 days 9/9/26
949 Spruce AVE 3 2 1,632 $1,050,000 $1,150,000 $704 4 days 8/4/26
Average: 3.5 2.8 2,393 $1,860,525 $1,743,891 $708 128 days
Viewing 1 - 50 of 79

The data relating to real estate for sale on this web site comes in part from the Broker Reciprocity Program (BR Program) of M.L.S. of Naples, Inc. Properties listed with brokerage firms other than this company are marked with the BR Program Icon or the BR House Icon and detailed information about them includes the name of the listing brokers. The properties displayed may not be all the properties available through the BR Program. The information provided is for consumers’ personal, non-commercial use and may not be used for any other purpose.