




 Eleven Eleven Central Condos for Sale Downtown Naples residences
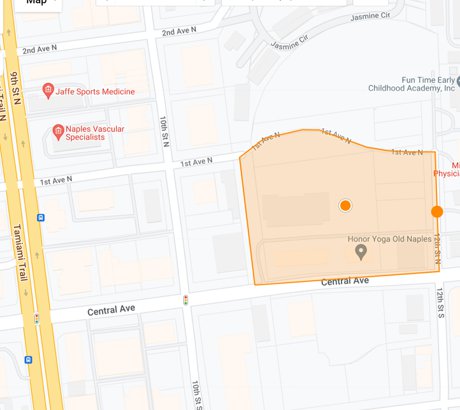 Eleven Eleven Central Map Search Explore all three phases
 Eleven Eleven Central Market Data Jump to listings and recent sales
Follow active Eleven Eleven Central listings and recent closed condo sales. The live report below covers the community across its three residential phases and all price ranges.
Read the Eleven Eleven Central community guide for residence and amenity context. The current condo search and community map help connect the report's figures with available properties.
Compare Residences Before Comparing Averages
Phase, floor plan and interior living area provide a useful starting point. Then compare floor level, exposure, terrace configuration, parking, storage and condition. Community-wide averages may combine homes with substantially different features.
Phase I at Eleven Eleven Central Read the phase comparison Phase II at Eleven Eleven Central Compare layouts and features Phase III at Eleven Eleven Central Review residence differences Eleven Eleven Central Amenities Explore the community lifestyle How to Read the Market Report
Active listings show asking prices. Closed sales show completed transactions within the displayed reporting period. When a chart uses a different time span, follow its own label. Listing counts and averages update as records change.
Separate interior living area from total area, terraces and other outdoor space. Review the individual transactions behind price-per-square-foot figures, including condition, furnishings and any known concessions. A small number of sales may not represent every phase or floor plan.
Use the Report for Your Next Move
Buyers can compare relevant recent sales with competing active listings. Sellers can use the same evidence to position a residence by its features and condition. Current association expenses, assessments and ownership terms also belong in the comparison.
For a wider view, explore Downtown Naples condos and the Naples luxury condo collection.
Contact Schulz Realty for an Eleven Eleven Central Market Analysis
Report figures depend on available listing data and may change. Confirm individual property details and use comparable transactions when evaluating a specific residence.
 The data relating to real estate for sale on this web site comes in part from the Broker Reciprocity Program (BR Program) of M.L.S. of Naples, Inc. Properties listed with brokerage firms other than this company are marked with the BR Program Icon or the BR House Icon and detailed information about them includes the name of the listing brokers. The properties displayed may not be all the properties available through the BR Program. The information provided is for consumers’ personal, non-commercial use and may not be used for any other purpose.