


Gulf-Front Estates • Bayfront Homes • Southport • Waterfront Sales
 Homes For Sale Gulf Front • Bayfront • Southport
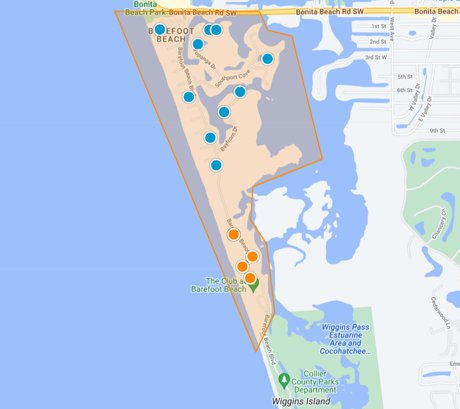 Map Search View the Same Listings on a Map
 Market Report Jump to Live Listings & Sales
The Barefoot Beach Market Report is the live-data companion to the permanent Barefoot Beach waterfront guide. The report can include Gulf-front estates, bayfront boating homes, Southport properties and other waterfront residences, so the strongest comparison begins by identifying the exact waterfront category.
Preferred Barefoot Beach valuation sequence: waterfront category → homesite and frontage → beach or boating characteristics → view width → elevation → dock, lift and seawall where applicable → construction generation → condition → closest relevant waterfront sales.
How to Read the Barefoot Beach Market Report
Active properties show current competition. Separate direct Gulf-front estates from bayfront and Southport homes before comparing asking prices.
Pending properties show where buyers are accepting current market positioning, although final negotiated prices are not known until closing.
Give the greatest weight to sales with similar waterfront type, frontage, homesite, construction generation and overall condition.
Use this only after selecting the correct competitive group. It does not measure Gulf frontage, bay width, dockage, seawall condition or redevelopment value.
Review marketing time together with original price, price reductions, construction status and the rarity of the property's waterfront characteristics.
Vacant land and older residences purchased primarily for redevelopment should be analyzed separately from completed luxury homes.
Gulf-Front Estates
Direct Gulf-front properties should first be compared with other beachfront transactions. Lot width, Gulf frontage, western exposure, dune and shoreline relationship, elevation, privacy and redevelopment potential can be more important than interior square footage alone.
Bayfront & Southport Boating Homes
Protected-water properties belong to a different comparison group. Evaluate water frontage, view width, dock ownership, lift capacity, seawall condition, water depth, maneuvering room and practical navigation toward the Gulf before applying premiums for interior finishes.
New Construction vs. Established Homes
Newer coastal construction may offer current structural systems, impact glazing, generators, elevators, modern pools and updated mechanical equipment. Established residences may nevertheless occupy superior Gulf or bay homesites. Separate the permanent land and waterfront characteristics from the condition and replacement cost of the improvements.
Continue Your Barefoot Beach Research

Barefoot Beach Waterfront Condos Market Report • Naples Waterfront Homes • Naples Luxury Homes
Barefoot Beach Valuation & Private Tours
Schulz Realty can help buyers and sellers distinguish Gulf-front estates, bayfront boating homes and Southport properties and then compare the strongest recent sales by waterfront position, homesite, frontage, construction and condition.
Contact Schulz Realty for Listings & Private Tours.Barefoot Beach inventory, asking prices, sales, waterfront classifications, beach and shoreline conditions, water depth, tides, dock ownership, boat-lift specifications, seawalls, permits, association obligations, Club membership availability, flood information, insurance requirements and individual property features can change or vary. Buyers and sellers should verify material information through current MLS data, surveys, association or Club documents, inspections, permits, insurance professionals and other appropriate qualified sources.
 The data relating to real estate for sale on this web site comes in part from the Broker Reciprocity Program (BR Program) of M.L.S. of Naples, Inc. Properties listed with brokerage firms other than this company are marked with the BR Program Icon or the BR House Icon and detailed information about them includes the name of the listing brokers. The properties displayed may not be all the properties available through the BR Program. The information provided is for consumers’ personal, non-commercial use and may not be used for any other purpose.